Petronas is a oil and gas company, which also known as the 8th most profitable company in the world. In this project, our brief was to design a dashboard and a design system which can be easily applicable to other oil plants.
If designed right, dashboards can help organizations make informed decisions that can dramatically impact business performance . However, designing an effective dashboard is not a walk in the park. In fact, it’s quite daunting and challenging. In manufacturing, providing access to plant data at the right level and time is critical to effective operations and key to achieving the organizations targets. In this project we had 2 main type of users: Plant Managers (decision makers) and operators. Decision makers need a clear understanding of the current situation and overall performance. Operators are required to quickly spot issues in real time to take corrective actions.
Before jumping into wireframes, we hosted different workshops for stakeholders from each department in order to develop their own layout and features for their particular service. At this stage, as designers we became invisible facilitators who gave stakeholders the confidence to express their own needs and develop their own ideas.
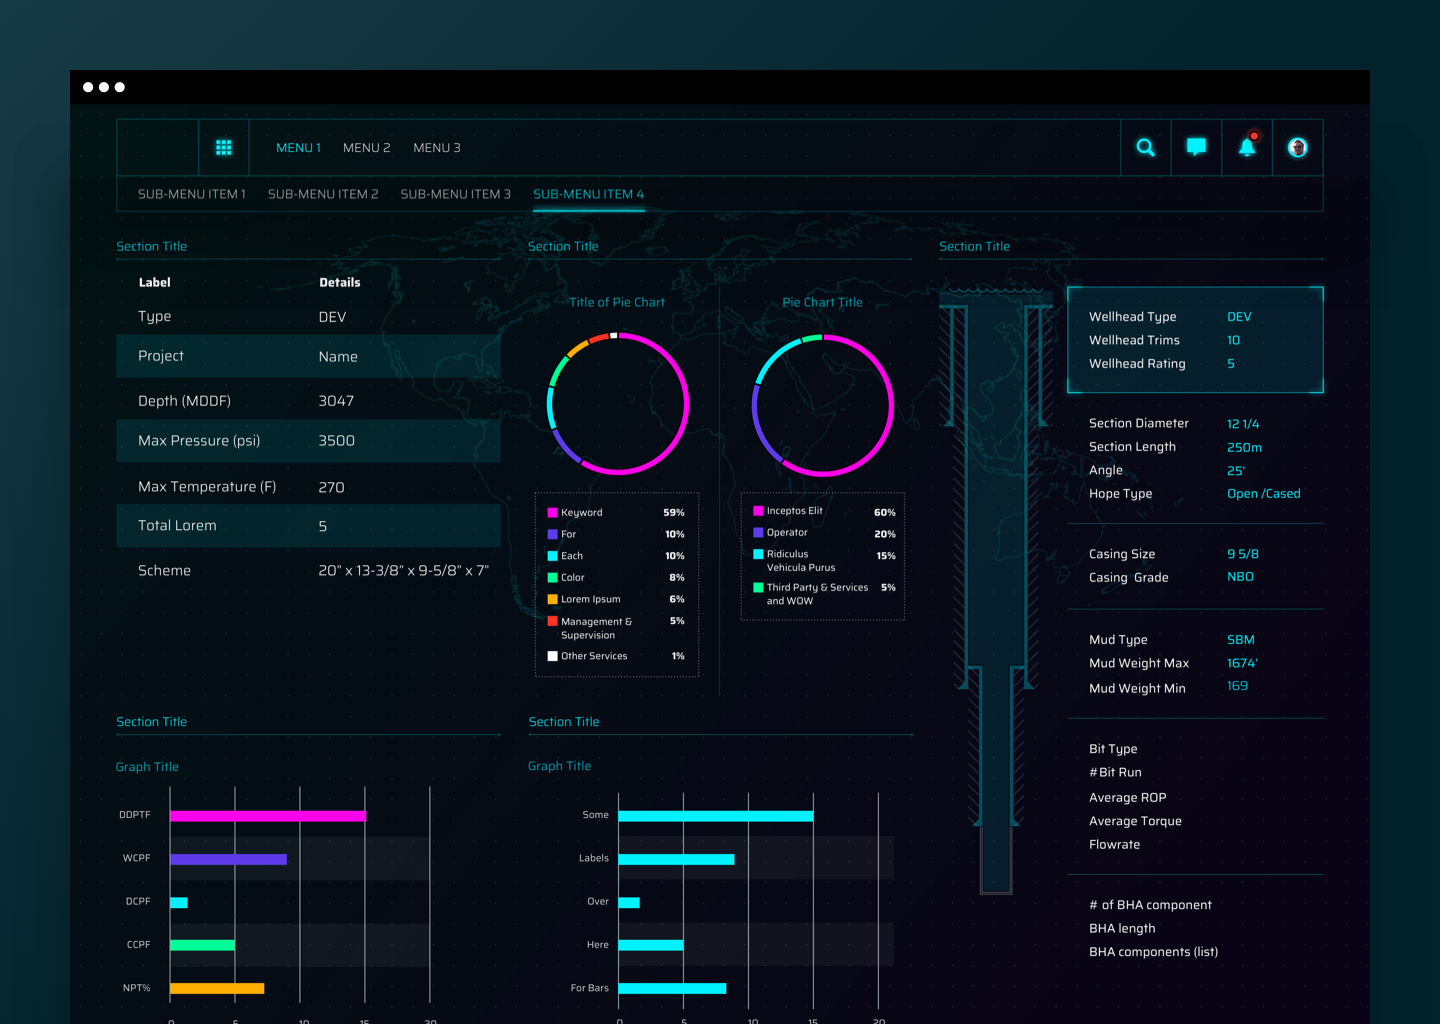
Our dashboard enabled better monitoring, more agile decision making and enhanced profitability by transforming plant data into actionable intelligence.
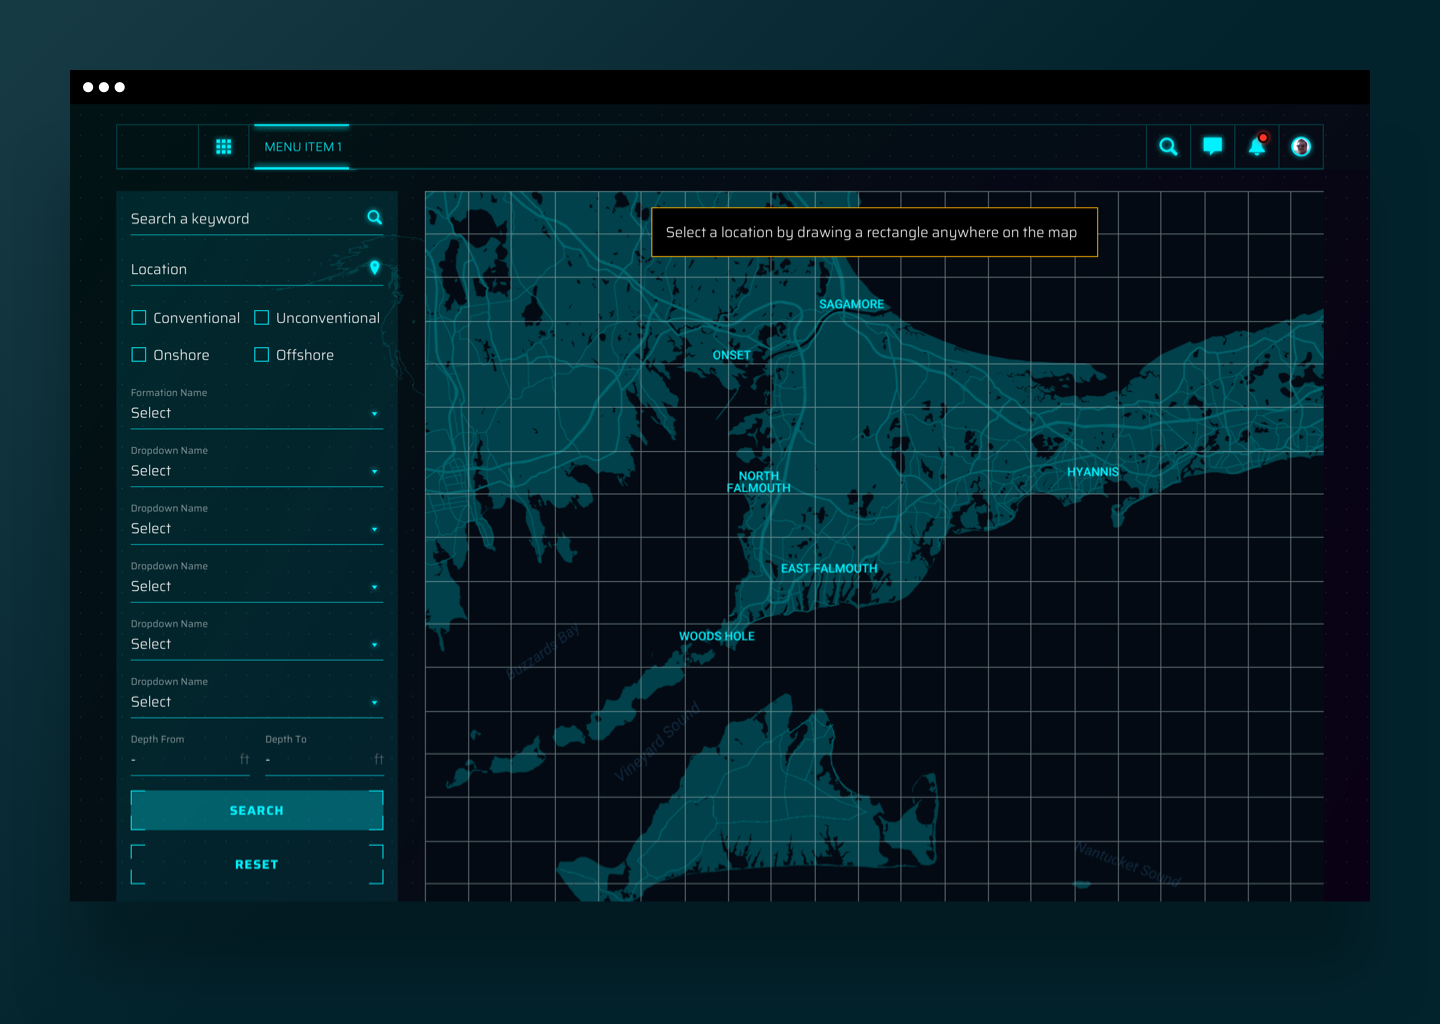
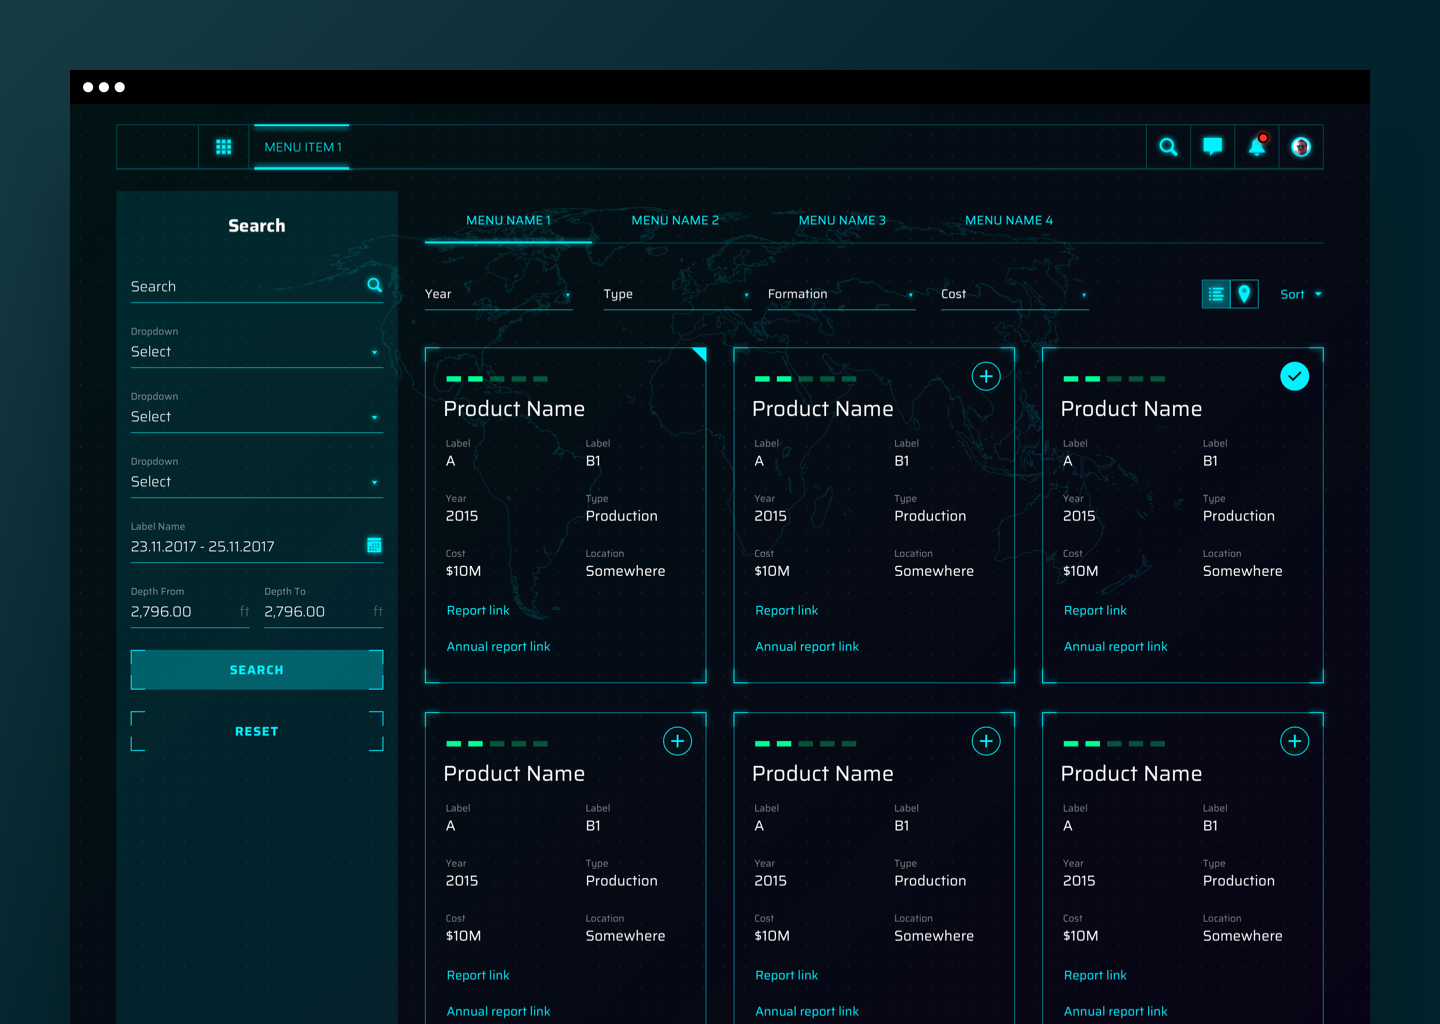
Reveals details as needed: We want each viewer to have access to the data they need — no less but also no more. Some users might need to be able to see a more granular view of the data — others could suffice with an overview. The main goal was to focus on most critical information while reducing the noise generated from displaying excessive data or non-data visuals. Efficient use of the limited available space was required, especially on smaller display mediums.
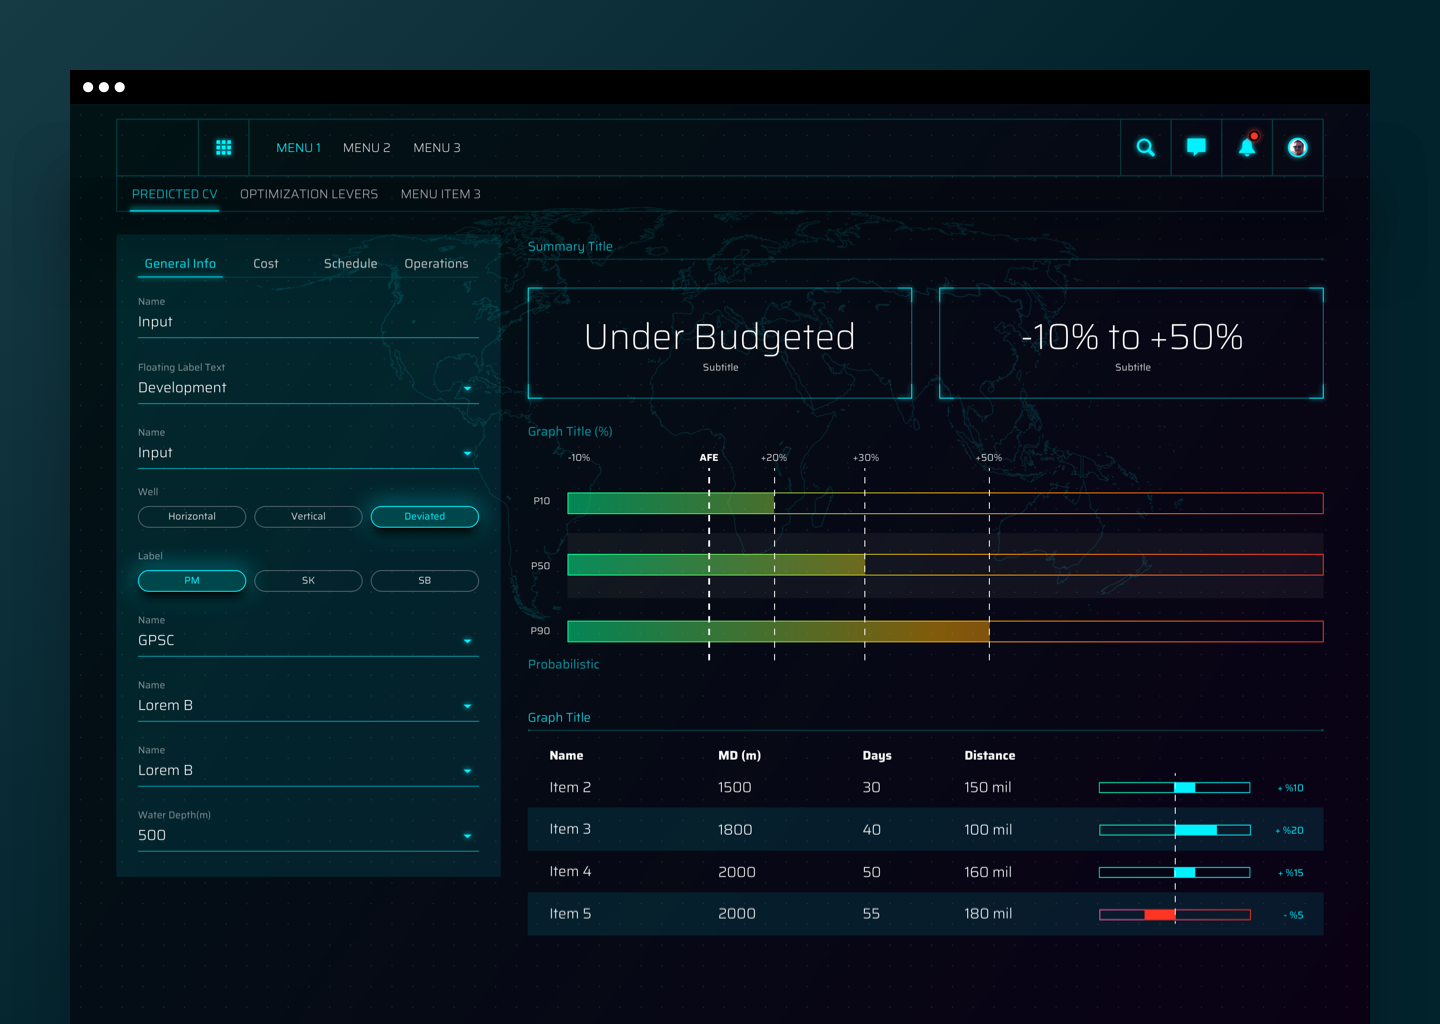
Makes the complex simple: We aimed for simpler and easy to understand design to provide clear context to visualizations in terms of time, area, scale and reference to avoid confusion.
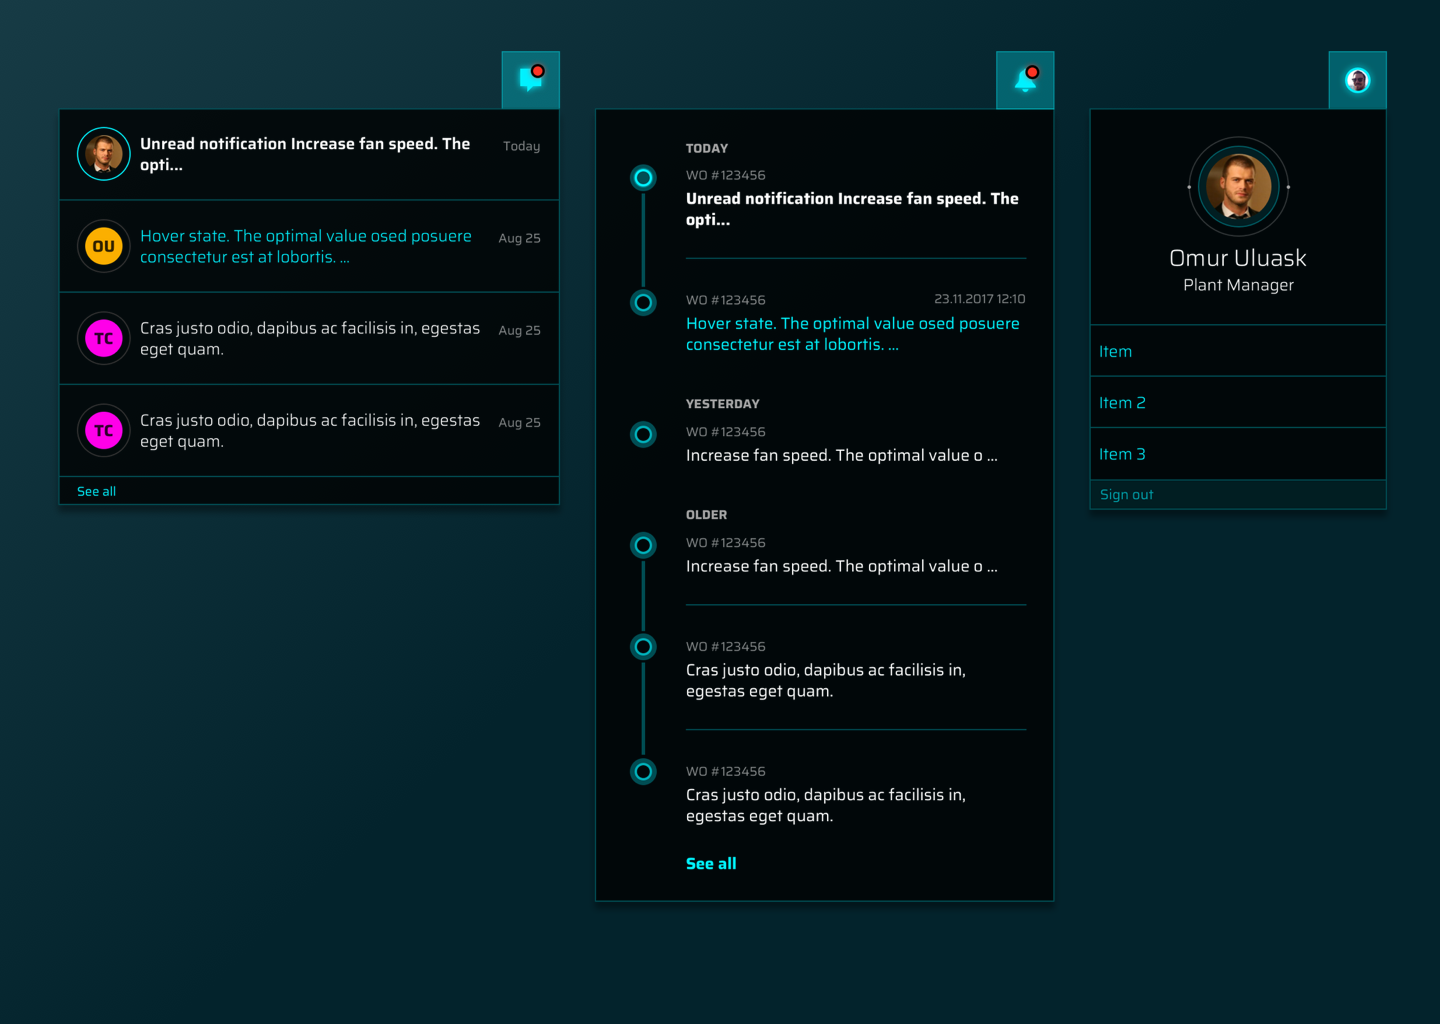
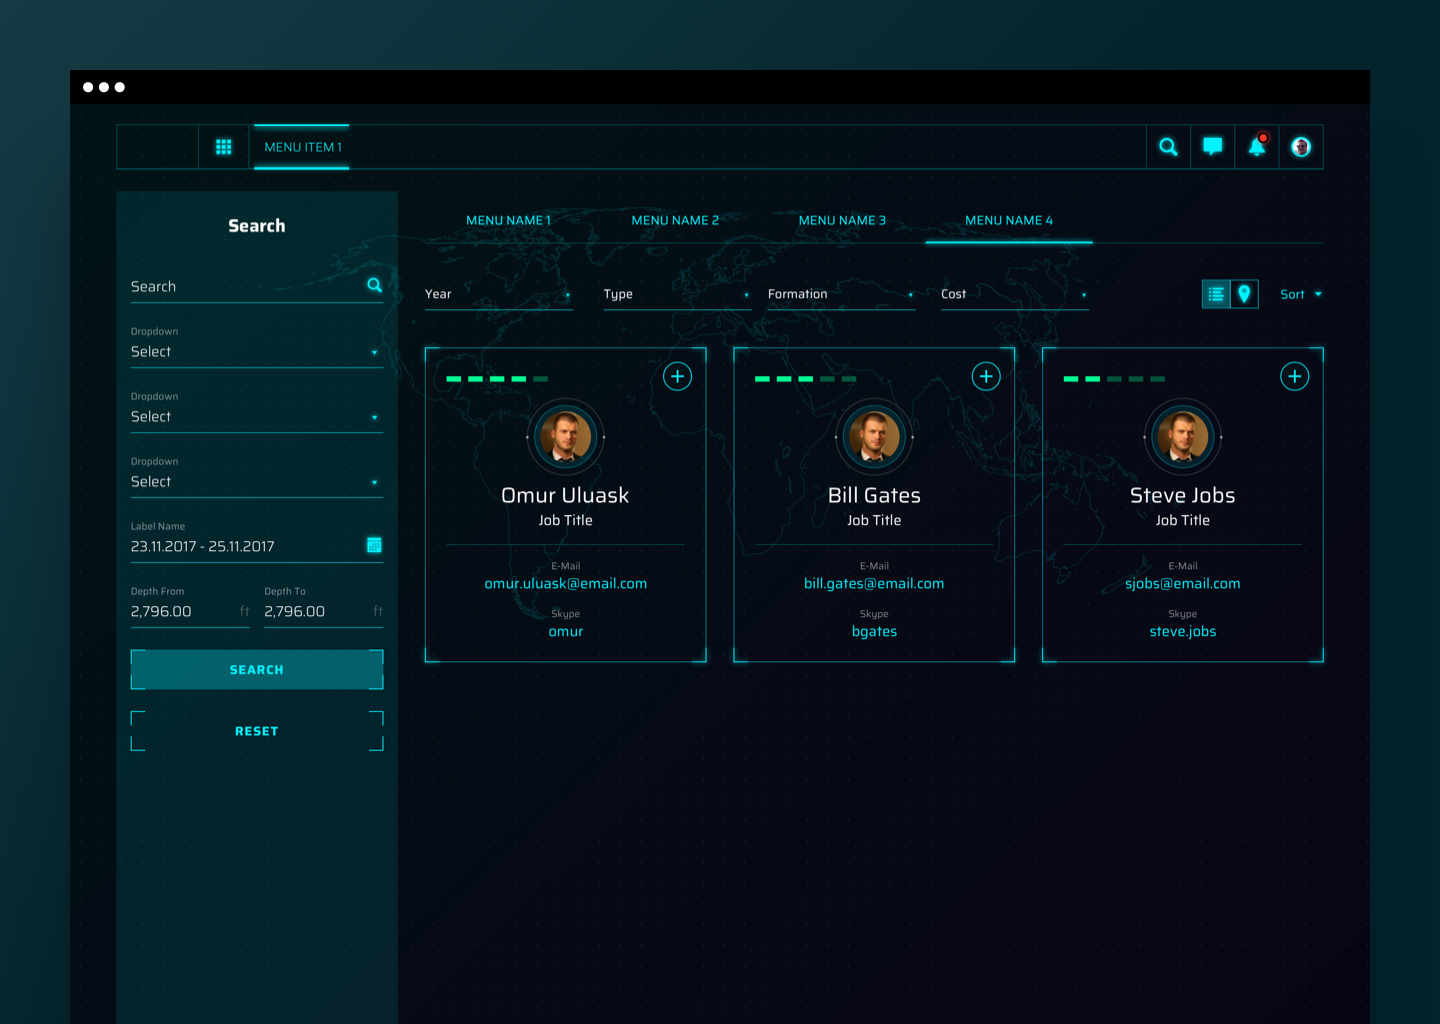
Visual cues to help users: Users are quick to detect patterns instead of remembering sparse data. We used space, orientation, shapes and sizes to form patterns. Also used borders to group relevant data together. We provided visual cues that help the user quickly identify patterns or interact with the data.
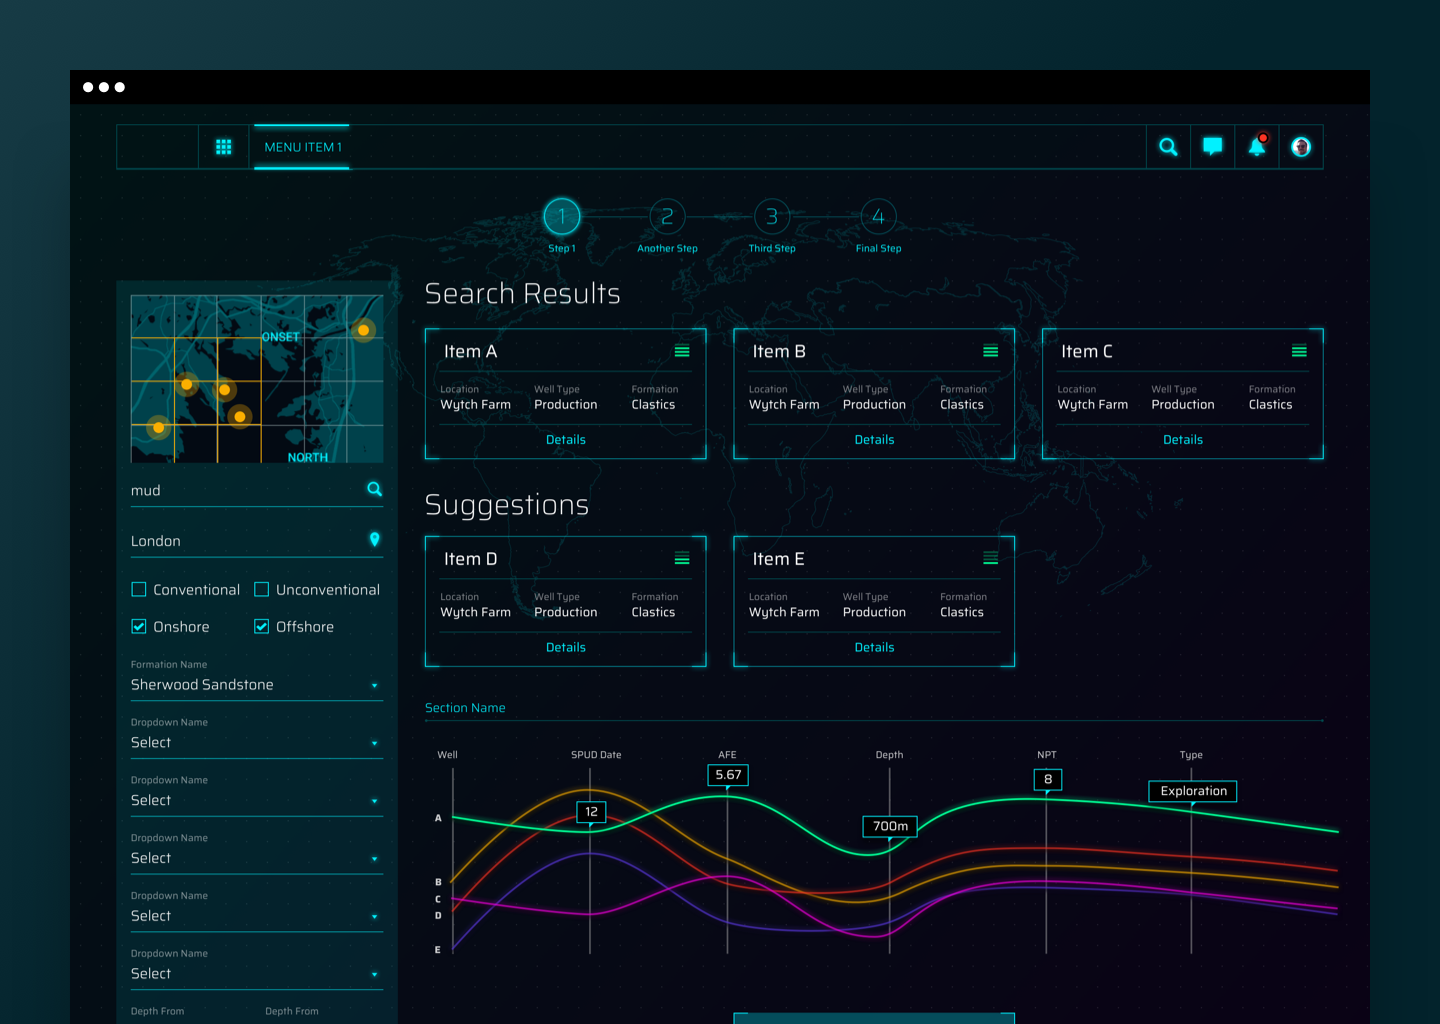
Maximize data ratio in visualizations: We removed extra graphical elements that add little or no data. We have avoided over-crowded plots that show very high frequency data or large number of trends, instead, filter or zoom in the data to the correct level.
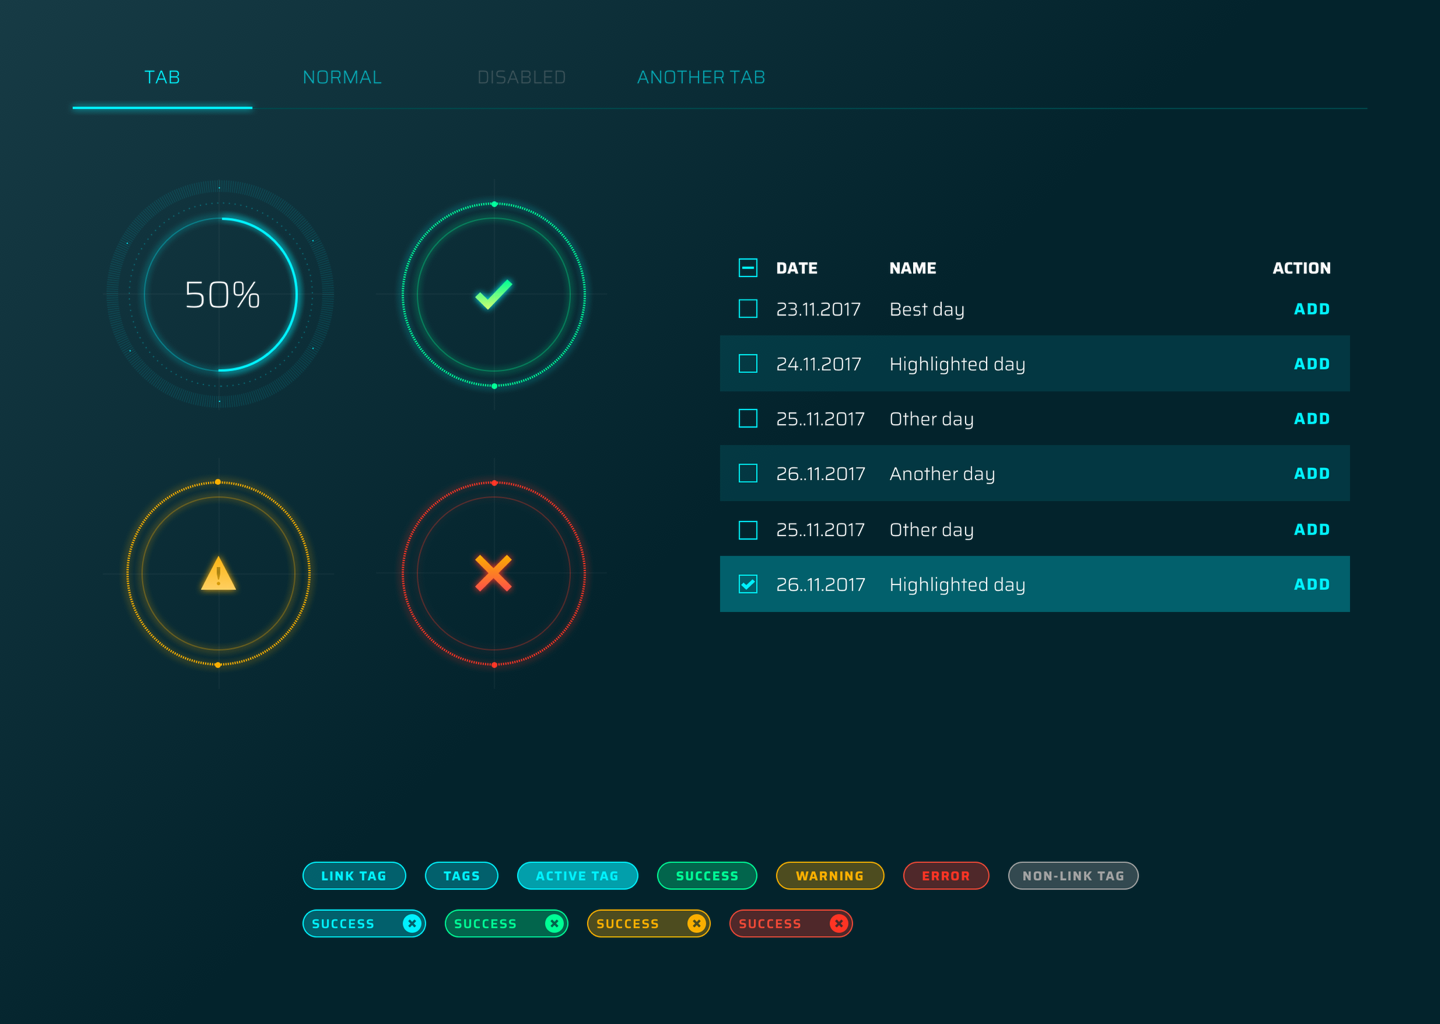
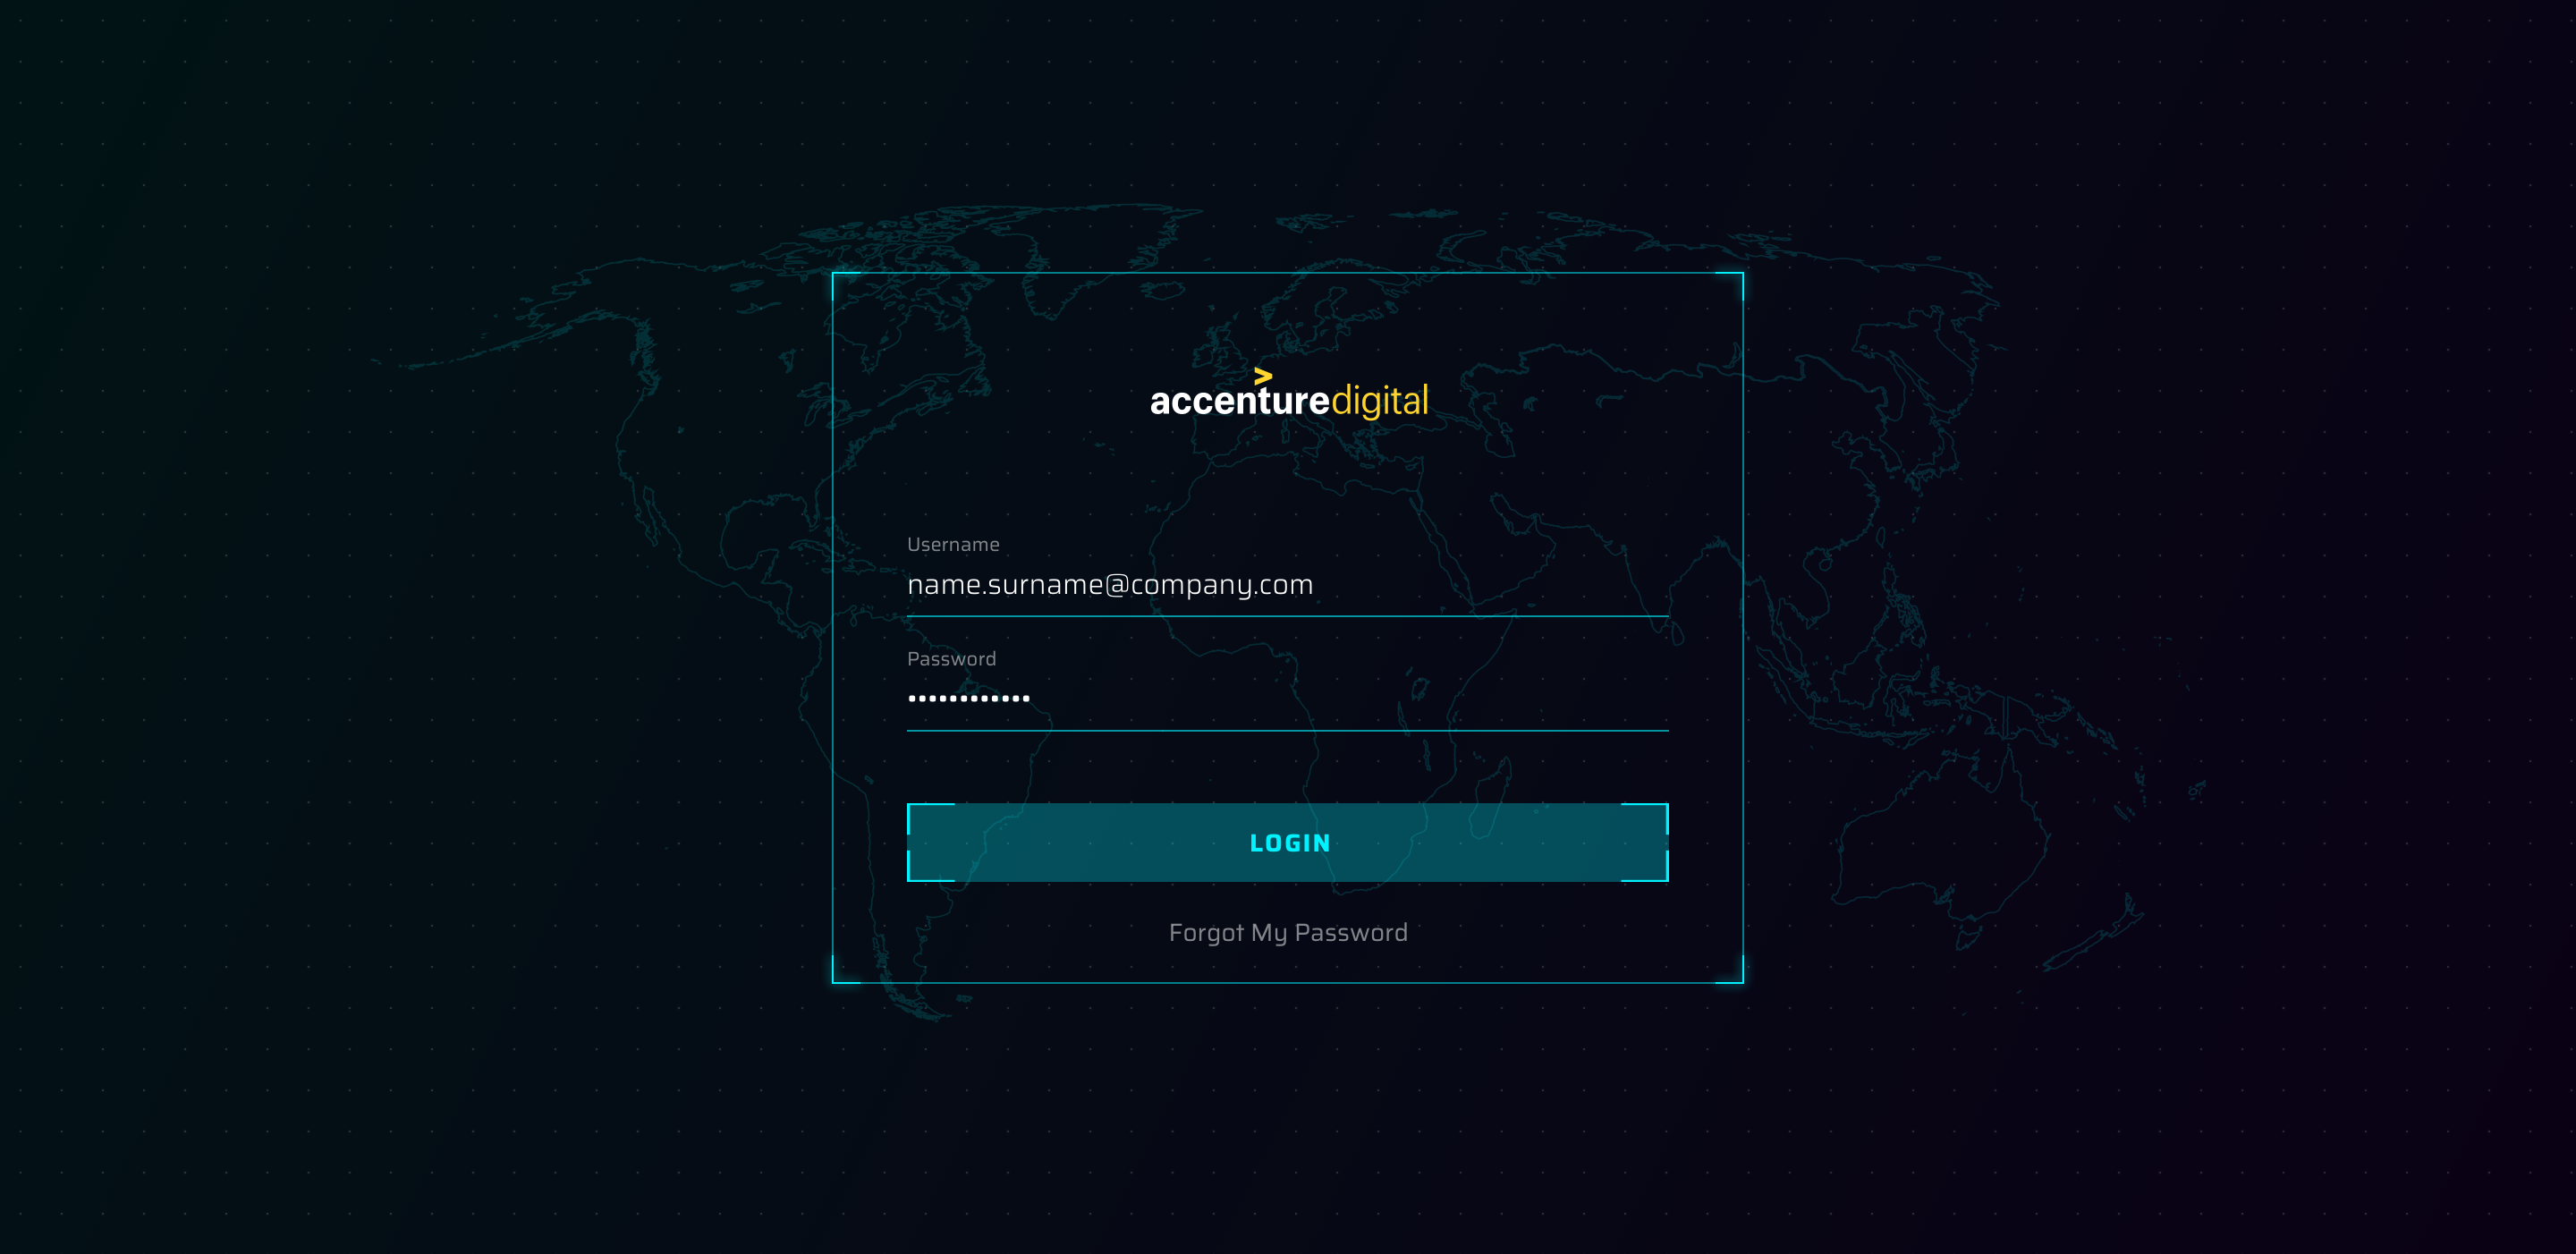
Use colors to encode meaning: We avoided using highly saturated colors or hard to distinguish hues as they lead to eye fatigue or loss if information. A ‘dark’ theme is chosen after careful consideration of a few colours.The important thing here is to stay consistent and not use too many different colors – an essential consideration when learning how to design a dashboard.
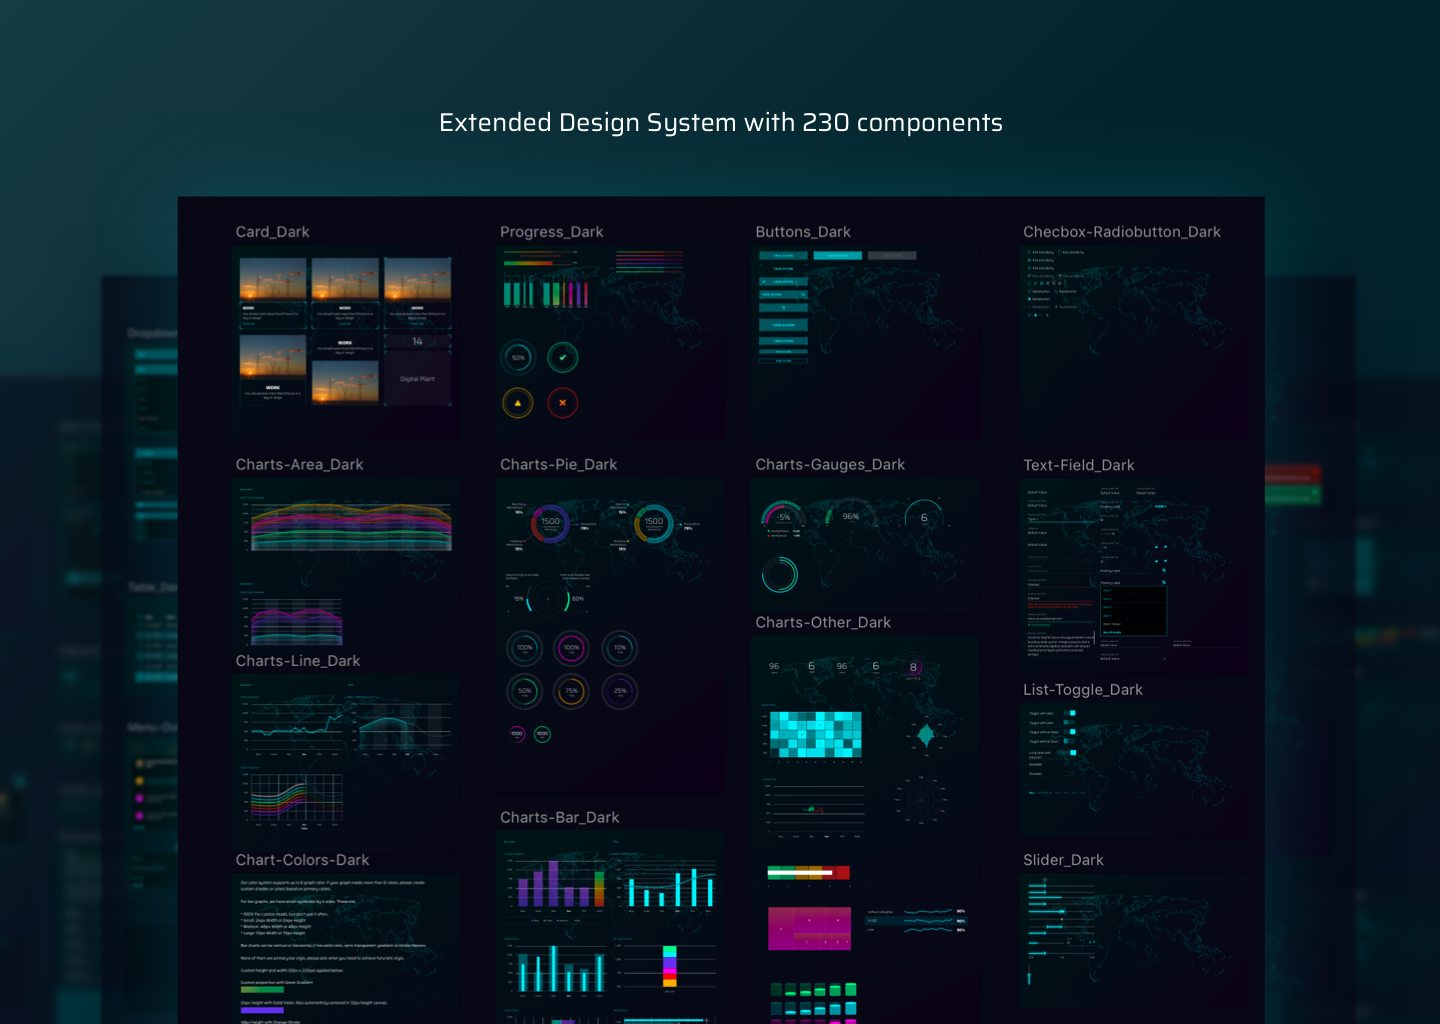
Design system with customisable sketch components that helps other designers to design with keeping the same experience and styling.